UI Guide
The Eval AI Library includes an interactive web dashboard with two main modules:
- Dashboard — visualize evaluation results, metrics, charts, and test case details
- API Connector — connect to any LLM API, upload datasets, and run evaluations directly from the browser
Launching the Dashboard
After Evaluation
results = asyncio.run(evaluate(
    test_cases=test_cases,
    metrics=metrics,
    show_dashboard=True,
    session_name="my-evaluation"
))
The dashboard opens automatically in your browser after evaluation completes.
Standalone Mode
View cached results from previous sessions:
| Flag | Default | Description |
|---|---|---|
--port | 14500 | Server port |
--host | 0.0.0.0 | Server host |
--cache-dir | .eval_cache | Directory for cached results |
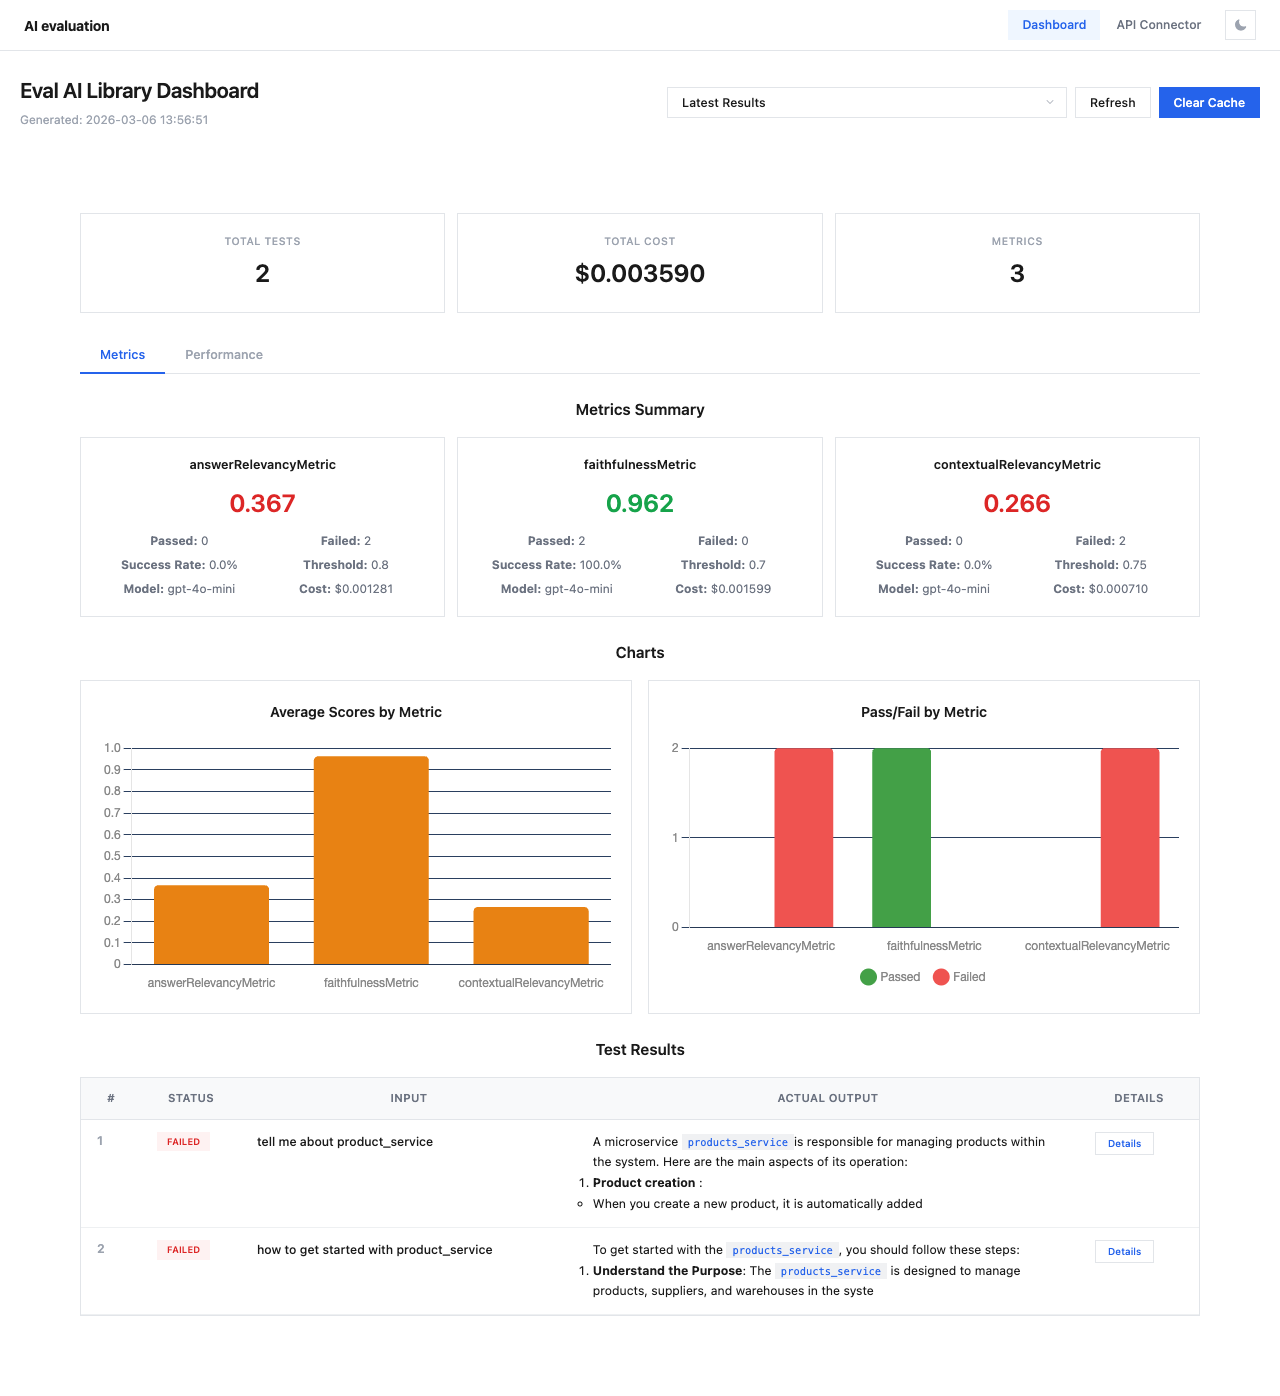
Overview
The main navigation bar provides access to both modules:
- Dashboard — evaluation results and analytics
- API Connector — no-code evaluation setup wizard
- Theme toggle — switch between light and dark themes
Sections
| Section | Description |
|---|---|
| Dashboard | Session overview, metrics summary, charts, and test results |
| Test Case Details | Detailed view of individual test cases with per-metric scores |
| Performance | Response times, token usage, and cost analysis |
| API Connector | Step-by-step wizard for running evaluations via any API |
Dark Theme
The dashboard supports both light and dark themes. Click the theme toggle button (☾/☀) in the top-right corner to switch.
