Dashboard Overview
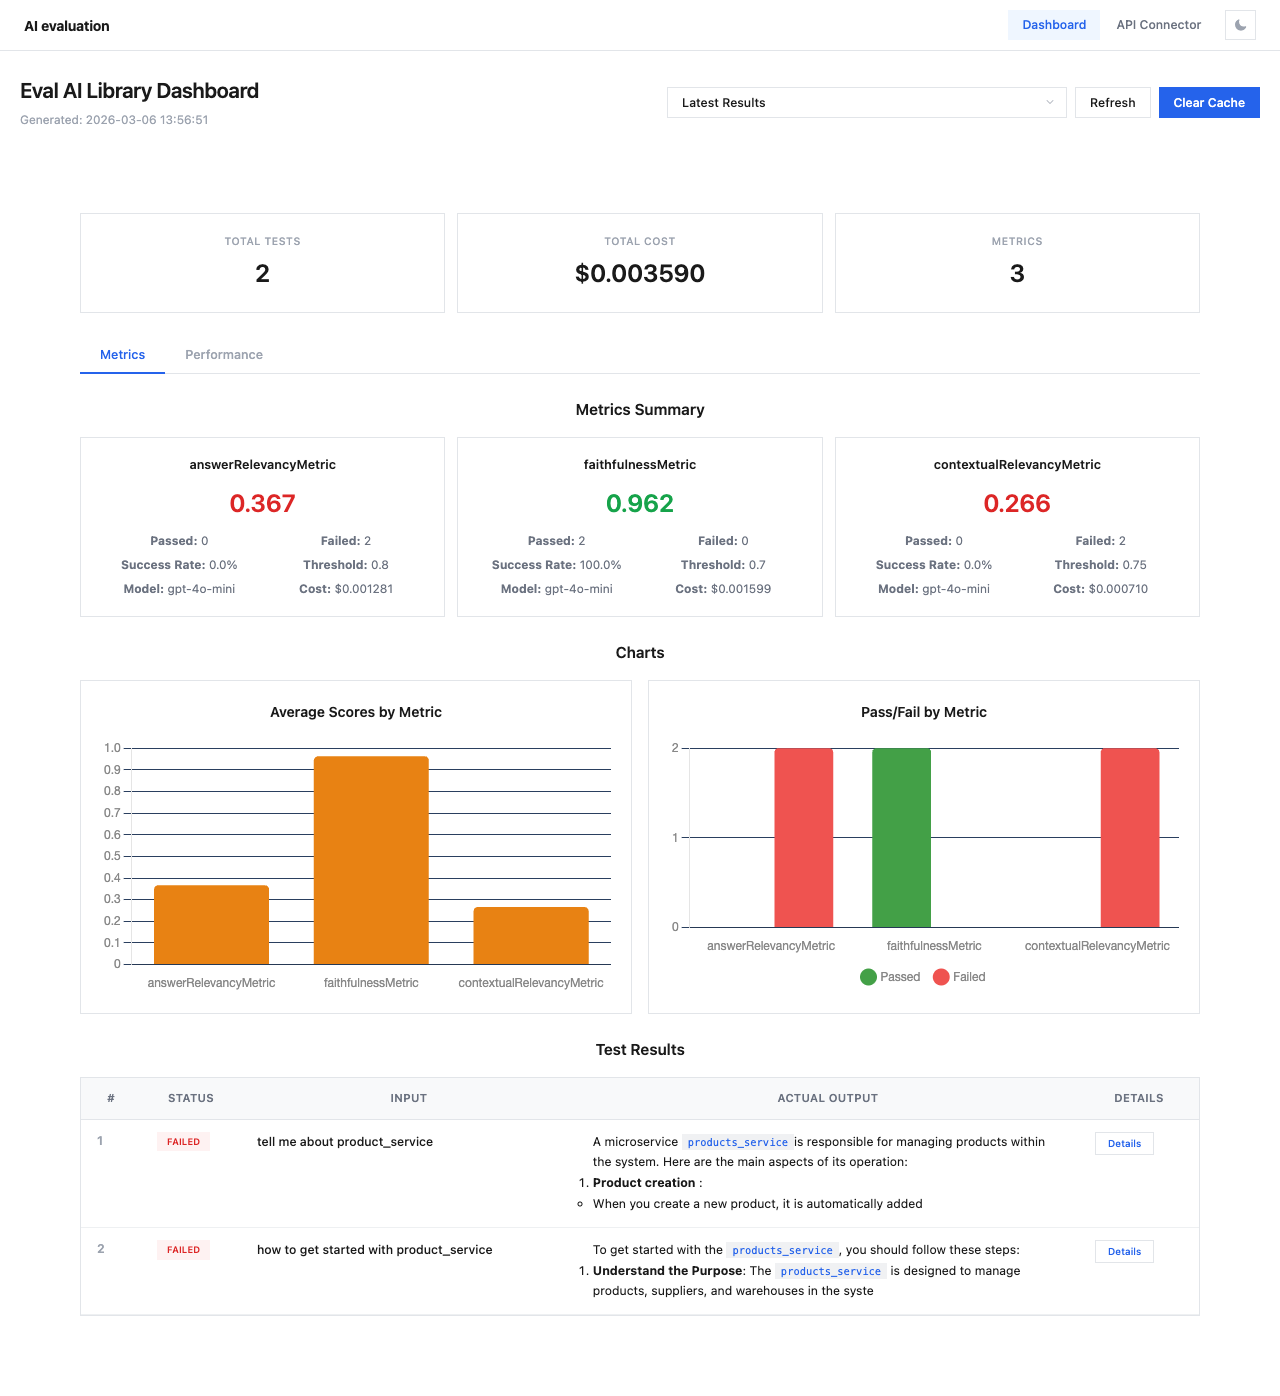
The Dashboard page is the main view for analyzing evaluation results. It displays session data with metrics, charts, and test results.
Session Selection
At the top of the page you'll find:
- Session dropdown — select from cached evaluation sessions or view the latest results
- Refresh button — reload data from the cache
- Clear Cache button — remove all cached session data
Tip
Use descriptive session_name values when running evaluations to make sessions easy to find:
Summary Cards
Three summary cards show key statistics:
| Card | Description |
|---|---|
| Total Tests | Number of test cases in the session |
| Total Cost | Combined API cost for all metric evaluations |
| Metrics | Number of metrics evaluated |
Metrics Tab
Metrics Summary
Each metric is displayed as a card with:
- Metric name — e.g.,
answerRelevancyMetric,faithfulnessMetric - Average score — color-coded (green for high, red for low)
- Passed / Failed count
- Success Rate — percentage of test cases that passed the threshold
- Threshold — the minimum score to pass
- Model — the evaluation model used (e.g.,
gpt-4o-mini) - Cost — API cost for this metric
Charts
Two charts provide visual analysis:
- Average Scores by Metric — bar chart comparing average scores across all metrics
- Pass/Fail by Metric — stacked bar chart showing pass (green) and fail (red) counts per metric
Test Results Table
The bottom section lists all test cases in a table:
| Column | Description |
|---|---|
| # | Test case number |
| Status | PASSED (green) or FAILED (red) badge |
| Input | The input query/prompt |
| Actual Output | The model's response (truncated) |
| Details | Button to open the detailed test case view |
Click Details on any row to open the Test Case Details modal.