Performance
The Performance tab provides insights into evaluation speed, token consumption, and costs.
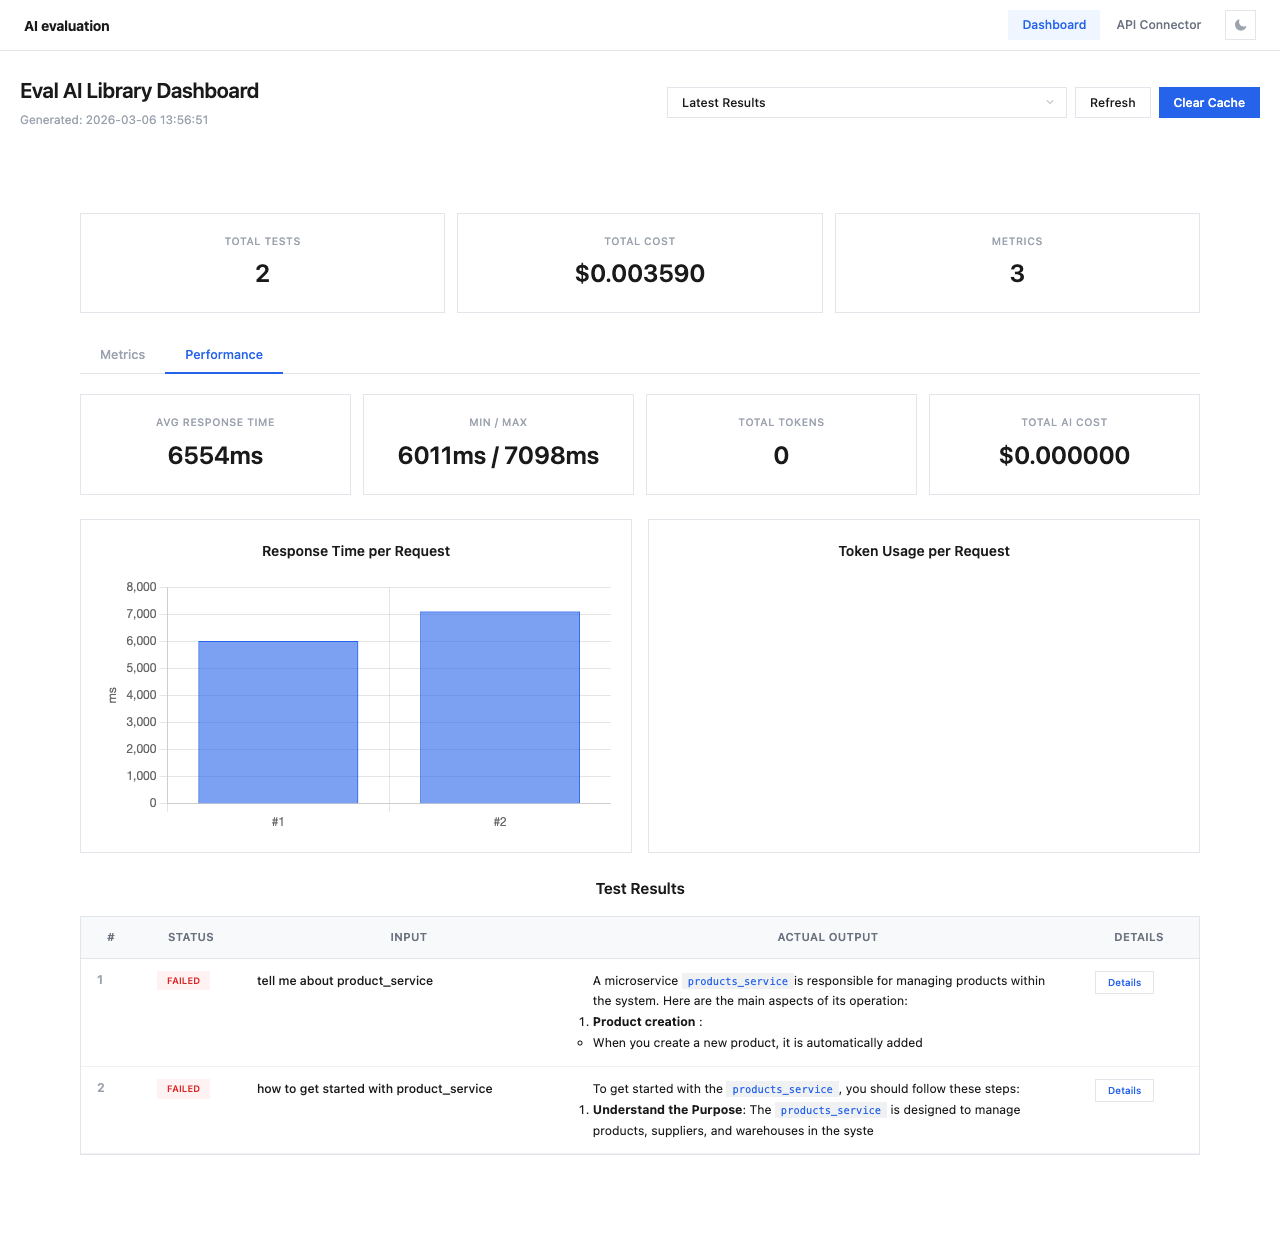
Switch to the Performance tab by clicking it next to the Metrics tab.
Performance Cards
Four summary cards display key performance metrics:
| Card | Description |
|---|---|
| Avg Response Time | Average time for API responses across all test cases |
| Min / Max | Fastest and slowest response times |
| Total Tokens | Total token count across all API calls |
| Total AI Cost | Combined cost for all API calls (separate from evaluation cost) |
Response Time Chart
The Response Time per Request bar chart shows the response time for each individual test case. This helps identify:
- Outliers with unusually slow responses
- Consistent performance patterns
- Potential rate limiting or throttling issues
Token Usage Chart
The Token Usage per Request chart displays token consumption per test case, useful for:
- Identifying verbose responses that may need prompt optimization
- Tracking token budget across evaluations
- Comparing token efficiency across different models
Tip
If response times are consistently high, consider:
- Using a faster model for evaluation (e.g.,
gpt-4o-miniinstead ofgpt-4o) - Adding
delay_between_requests_msto avoid rate limiting - Reducing context size in your test cases