Test Case Details
Clicking the Details button on any test case in the results table opens a detailed modal view.
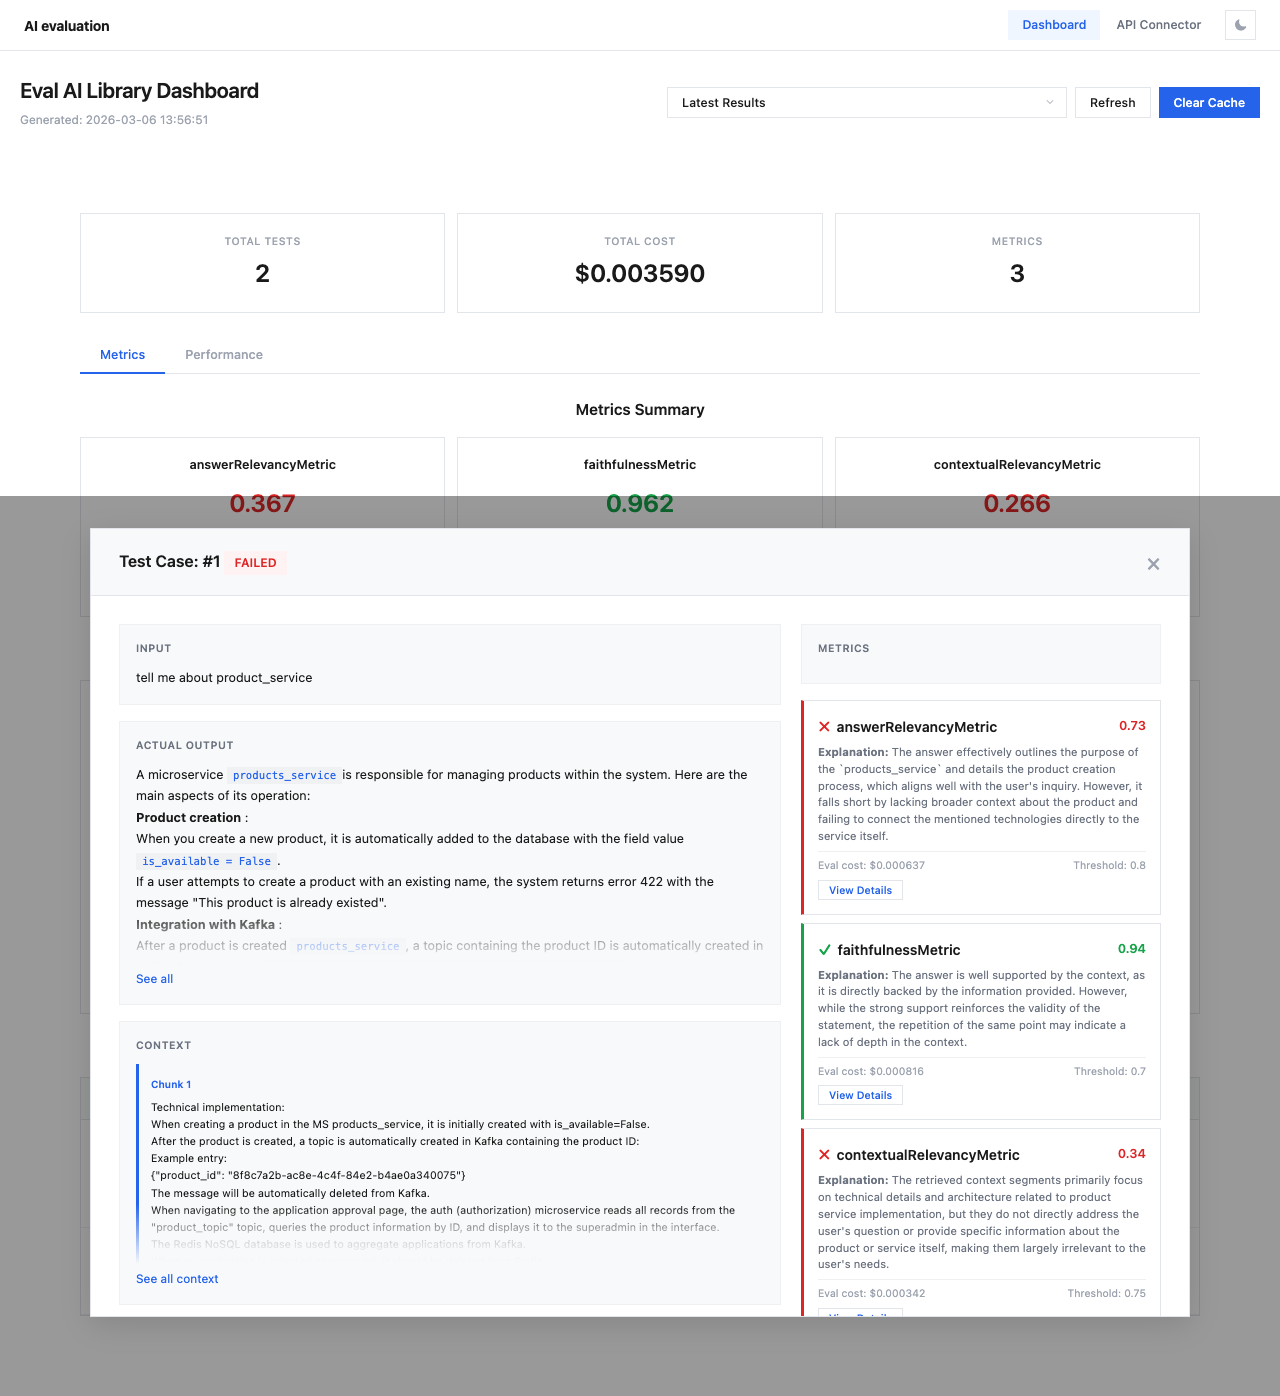
Modal Layout
The detail modal is split into two sections:
Left Panel — Test Data
- Input — the original query or prompt sent to the model
- Actual Output — the complete model response (with markdown rendering)
- Context — retrieval context chunks provided for evaluation (expandable with "See all" link)
Note
Context data is shown in collapsible blocks. Click See all to expand the full context, or Collapse to minimize it.
Right Panel — Metric Results
Each evaluated metric is displayed as a color-coded card:
| Element | Description |
|---|---|
| Status icon | ✓ (green) for passed, ✗ (red) for failed |
| Metric name | e.g., answerRelevancyMetric |
| Score | Numeric score (0.0 to 1.0) |
| Explanation | AI-generated reasoning for the score |
| Eval cost | Cost of this specific evaluation |
| Threshold | The pass/fail threshold |
| View Details | Expand to see the full evaluation log |
Evaluation Log
Click View Details under any metric to see the complete evaluation log, which includes:
- Step-by-step reasoning from the evaluation model
- Extracted statements and their verification
- Intermediate scores and calculations
- The final verdict with justification
Color Coding
Metric cards use border colors to indicate status:
- Green border — metric passed (score ≥ threshold)
- Red border — metric failed (score < threshold)
The score value itself is also color-coded for quick visual assessment.